
Statistical analysis software refers to computer applications that use statistical approaches to analyze, interpret, and visualize data.
These software tools provide a wide range of tools and methodologies for researchers, analysts, and data scientists to explore, summarize, and analyse data in order to draw relevant insights and make data-driven decisions.
Academic, business, healthcare, social sciences, marketing, finance, and government are just a few of the industries that use statistical analysis software.
It enables users to carry out data analysis tasks such as data cleansing, data transformation, descriptive statistics, inferential statistics, hypothesis testing, regression analysis, data visualization, and others.
There are numerous statistical analysis software solutions on the market, ranging from open-source to commercial. IBM SPSS Statistics, SAS, R, Python (including statistical libraries such as NumPy, Pandas, and SciPy), Stata, JMP, and Minitab are some of the most prominent statistical analysis software packages. We are listing top 10 free Statistical Analysis Software 2023.
1. IBM SPSS Statistics
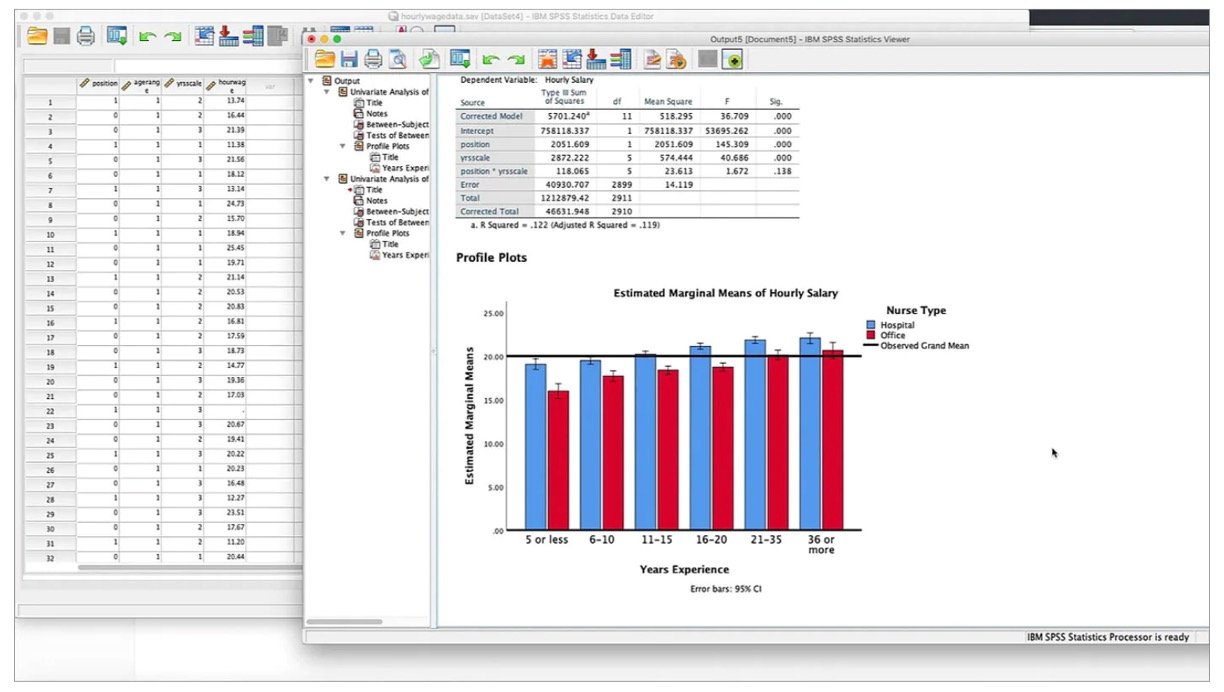
IBM SPSS Statistics is a popular statistical software package that is widely used in academia, research, and industry for data analysis, reporting, and visualization. Some of the key features of IBM SPSS Statistics include:
1. Comprehensive statistical analysis encompasses a wide range of statistical approaches for data analysis, such as descriptive statistics, inferential statistics, non-parametric tests, factor analysis, and cluster analysis.
2. Data cleansing, transformation, recoding, and missing value imputation tools.
3. A variety of options for making charts, graphs, and representations to aid in efficient data communication.
4. Supports syntax-based programming for automation, customization, and functionality extension.
5. Text analytics, geospatial analytics, and machine learning capabilities for evaluating unstructured data and constructing predictive models are examples of advanced analytics.
6. Reporting and output options include the ability to generate reports and export results to popular file formats.
7. Interface is simple to use, with a point-and-click environment and an intuitive data editor.
8. For the safety of sensitive data, features such as data encryption, password protection, and user authentication are available.
9. Supports a variety of data types for easy data integration.
10. For assistance and training, there is extensive documentation, tutorials, online forums, and paid support alternatives.
2. JMP
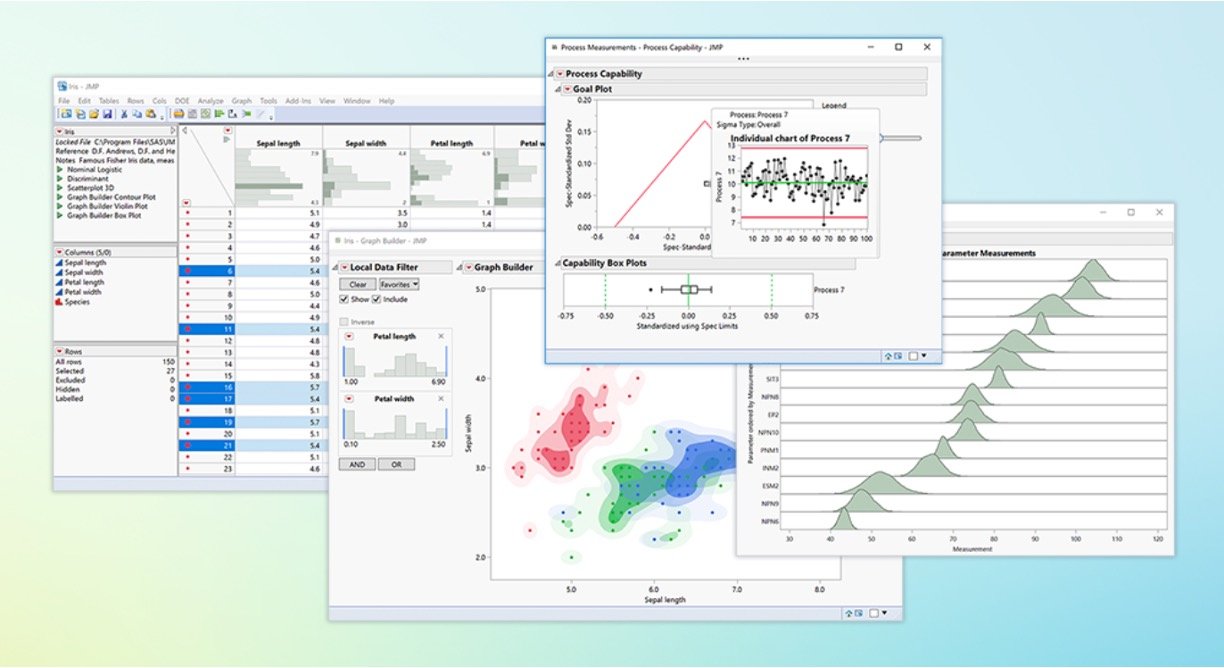
1. Rich and interactive visualizations for exploring and understanding data graphically, such as scatter plots, histograms, box plots, heatmaps, and contour plots.
2. A broad range of statistical techniques, such as descriptive statistics, inferential statistics, regression analysis, ANOVA, DOE (Design of Experiments), multivariate analysis, and others.
3. Drag-and-drop data manipulation, filtering, and cleaning interface for interactive data exploration.
4. Interactive graphics technologies that allow users to visually and dynamically explore data, such as brushing, connecting, and zooming.Profiler: A graphical tool that aids users in understanding and optimizing models by displaying the effects of changing inputs on model outputs.
5. JMP Scripting Language (JSL) scripting is supported for automation, customisation, and expanding functionality.
6. Dynamic and configurable reporting solutions for building interactive data communication reports and dashboards.
7. Excel, CSV, SAS datasets, and other data formats are supported for smooth data integration.
8. Quality control, dependability, and Six Sigma process improvement tools.
9. Advanced multivariate data analysis techniques such as principal component analysis (PCA), partial least squares (PLS), and others.
3. XLSTAT

1. XLSTAT includes descriptive statistics, inferential statistics, regression analysis, ANOVA, factor analysis, survival analysis, multivariate analysis, time series analysis, and other statistical analysis tools.
2. Extensive data visualization capabilities, including scatter plots, line charts, bar charts, histograms, contour plots, and more, as well as customization options for axes, labels, colors, and styles.
3. Advanced machine learning and data mining tools for predictive modeling and pattern identification, such as decision trees, random forests, k-nearest neighbors, principal component analysis (PCA), cluster analysis, association rules, and more.
4. Comprehensive experimental design tools for optimizing studies and interpreting experimental data, including factorial design, response surface approach, mixed-design ANOVA, and more.
5. ARIMA, GARCH, exponential smoothing, spectral analysis, and other advanced time series analysis tools for modeling and forecasting time-dependent data.
6. For evaluating complicated data structures and establishing statistical conclusions, advanced statistical modeling techniques such as logistic regression, generalized linear models (GLM), mixed models, and others are used.
7. Monte Carlo simulation tools are built in, enabling for probabilistic analysis, uncertainty analysis, and sensitivity analysis in statistical models.
8. Rich visualization and reporting capabilities, including interactive plots, tables, charts, and summary statistics, with customization, annotation, and export to Excel, Word, PowerPoint, and PDF.
9. XLSTAT integrates seamlessly with Microsoft Excel, providing for data analysis and visualization within the familiar Excel environment, as well as the ability to use Excel formulas and functions.
4. Grapher
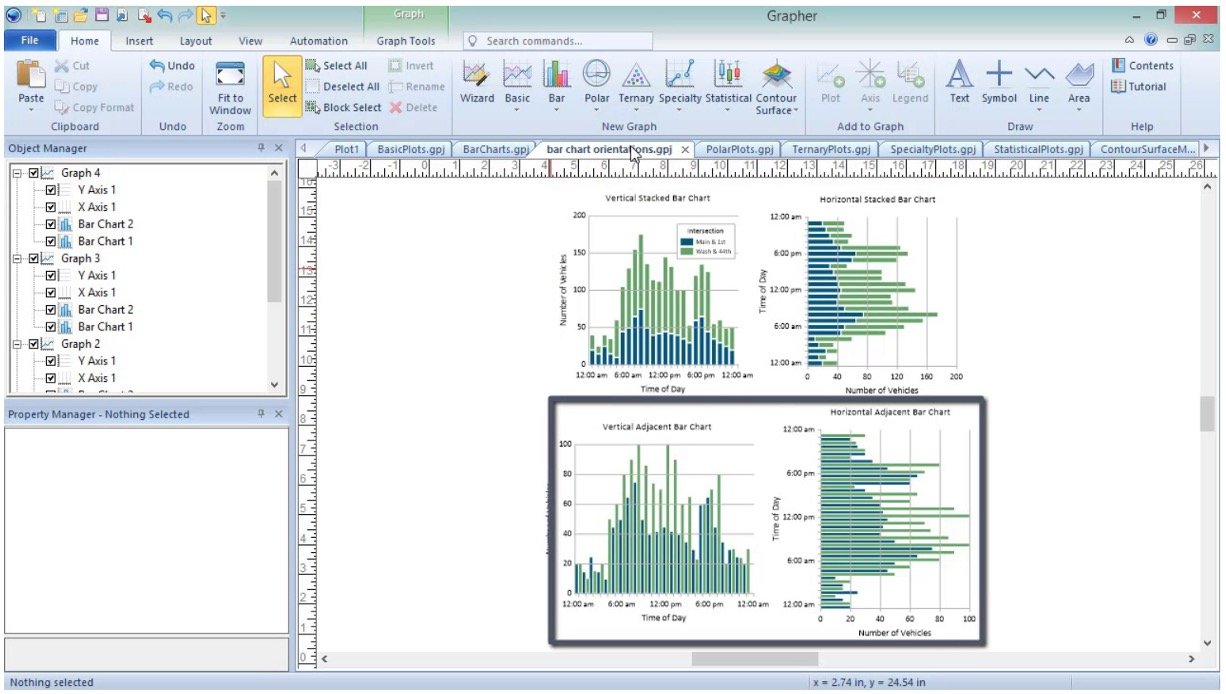
1. A wide range of graph types, including line plots, scatter plots, bar charts, contour plots, 3D plots, polar plots, and more.
2. Customizable graph attributes include axis properties, title, legend, color schemes, typefaces, and more.
3. Supports data import from a variety of file formats, including Excel, CSV, and text files, with options for data modification, filtering, and cleaning.
4. Error bars, trend lines, data point labels, data markers, and data fitting are advanced plotting features.
5. Allows you to plot numerous datasets on a single graph for easy comparison and study.
6. Supports mapping and display of geospatial data, such as GIS data, contour maps, and digitized maps.
7. Options for basic statistical analysis, such as descriptive statistics, trend analysis, and data interpolation.
8. For sophisticated users, its robust scripting language allows for automation and customization.
9. Export graphs to a variety of formats, including image files, vector files, and PDF, for simple sharing and publication.
10. The UI is intuitive and simple to use, with interactive tools for creating and altering graphs.
5. Minitab Statistical Software

1. Includes descriptive statistics, inferential statistics, regression analysis, ANOVA, DOE (Design of Experiments), control charts, capability analysis, time series analysis, and other techniques.
2. Use scatter plots, histograms, box plots, dot plots, control charts, Pareto charts, and other interactive data visualization tools to visually explore and interpret data.
3. Options for data import and modification include data cleansing, data transformation, and data reshaping for simple data preparation.
4. Control charts, process capability analysis, gage studies, and reliability analysis are advanced quality techniques used for quality control and process optimization.
5. Tools for examining model assumptions and diagnostic analysis that are simple to use, such as probability plots, residual plots, and normality plots.
6. A variety of hypothesis testing alternatives are available, including one-sample t-tests, two-sample t-tests, chi-square tests, ANOVA, nonparametric tests, and more.
7. Tools for creating and analyzing tests in order to enhance processes and product quality.
8. Tools for calculating sample sizes and statistical power while designing experiments and studies.
9. Advanced time series analysis techniques for studying time-dependent data, such as ARIMA models, exponential smoothing, and seasonal decomposition of time series (STL).
10. Automation and customisation are supported through its scripting language, Minitab Macros, for expert users.
11. Interface is simple to use, with a menu-driven and point-and-click approach for easy navigation and analysis.
6. OriginPro
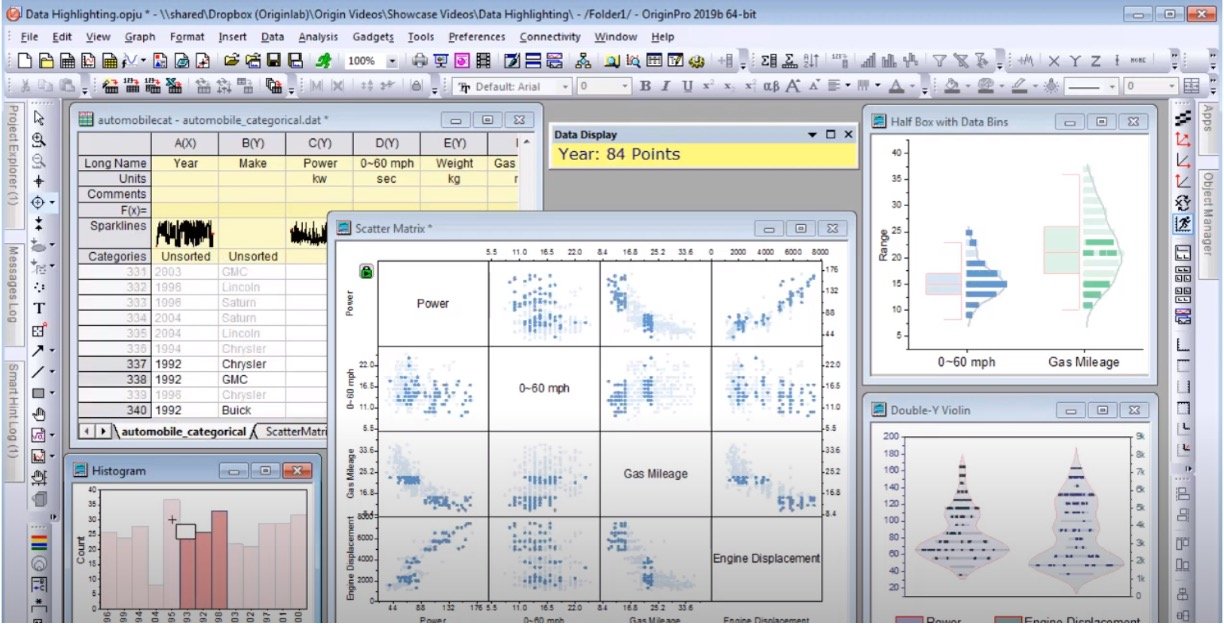
1. Line plots, scatter plots, bar charts, contour plots, surface plots, and other 2D and 3D graph formats are available, with comprehensive customization options for axes, labels, colors, and styles.
2. Descriptive statistics, inferential statistics, regression analysis, ANOVA, multivariate analysis, nonlinear fitting, peak analysis, picture analysis, and other data analysis methods are available.
Batch processing power for automating repetitive procedures and performing analysis and visualization on various datasets.
3. Flexible programming capabilities include a built-in scripting language (LabTalk), Python and R compatibility, and automation with Origin C, allowing for bespoke analysis, automation, and functionality extension.
4. Data can be imported from a variety of file types, including Excel, CSV, text files, and others, with options for data modification, filtering, and cleaning.
5. High-quality, publication-ready graphs and visualizations with rich formatting, annotation, and export options to vector files, image files, and PDF.
6. Provides statistical reports, templates, and wizards for common data analysis activities, making statistical studies and report generation simple.
7. Data brushing, linking and brushing, data point identification, and data filtering are interactive techniques for visually exploring and analyzing data.
8. The ability to generate multi-panel and multi-layer graphs in order to exhibit numerous datasets or graph types in a single plot for simple comparison and study.
9. Supports sophisticated graph formats for advanced data visualization and analysis, such as Smith charts, ternary diagrams, spider plots, and more.
Looking For More Scholarship Programs? Click here
7. TIMi Suite

1. Advanced tools for developing and testing predictive models that employ a variety of approaches including as decision trees, neural networks, logistic regression, support vector machines, gradient boosting, and others.
2. TIMi Modeler automates model construction by selecting the best models based on performance measures and providing insights into model accuracy, stability, and interpretability.
3. Stacking, bagging, and boosting are ensemble modeling strategies used to combine numerous models and improve model performance.
4. Data cleaning, transformation, imputation, feature selection, and feature engineering are all part of the comprehensive data preprocessing capabilities.
5. ARIMA, exponential smoothing, and seasonality detection are advanced time series analysis tools for forecasting and modeling time-dependent data.
6. Variable selection and feature engineering tools are available to help discover useful predictors and improve model performance.
7. Tools for understanding and explaining model predictions, such as partial dependence graphs, feature importance analyses, and model performance measures, are available.
8. Predictive models can be deployed as RESTful web services or embedded in business applications for real-time prediction and decision-making.
9. Cross-validation, holdout validation, and bootstrapping are all powerful model validation methods for assessing model performance and reducing overfitting.
10. Rich visualization and reporting options, including interactive dashboards, graphs, tables, and summary statistics, are available for displaying model findings.
11. Collaborative features enable team-based modeling, model versioning, and data sharing, as well as scalable processing for huge datasets and big data analytics.
12. For quick data access and analysis, seamless interaction with a variety of data sources such as databases, spreadsheets, CSV files, and more.
Get Professional Job Ready & In-demand Career Certificates
8. Number Analytics
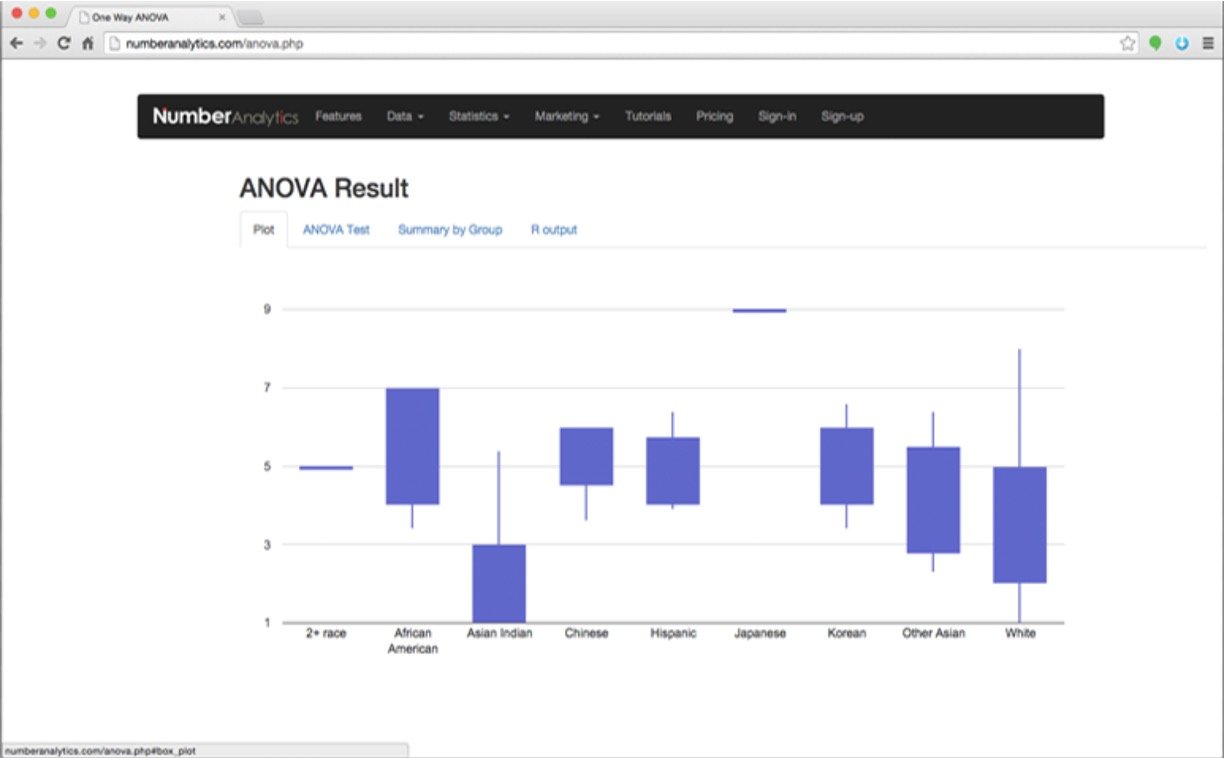
1. Exploration tools for numerical data, such as descriptive statistics, data visualization, and data profiling, to acquire insights into the data’s properties and patterns.
2. Cleaning and preparation functions for numerical data, such as handling missing values, data imputation, data transformation, and outlier detection, to assure data quality and correctness.
3. A variety of statistical approaches used to identify relationships, patterns, and trends in numerical data, such as regression analysis, correlation analysis, hypothesis testing, and multivariate analysis.
4. Machine learning algorithms, time series analysis, and forecasting techniques are tools for developing predictive models using numerical data to create data-driven predictions and forecasts.
5. Options for creating relevant and informative visualizations of numerical data, including as charts, graphs, and dashboards, for efficient communication of data.
6. Advanced analytics capabilities for addressing difficult problems and generating data-driven decisions, such as optimization, simulation, and predictive modeling.
7. Integration with other data analytics tools, databases, and platforms enabling consistent data flow and analysis across systems.
8. Processing massive numerical datasets in an efficient and scalable manner to manage big data analytics activities and deliver results in a timely manner.
9. Customization and extensibility features enable analytics workflows, algorithms, and visualizations to be tailored to unique business needs or requirements.
10. User-friendly design with intuitive menus, workflows, and documentation to aid in user adoption and simplicity of use for individuals with varied degrees of technical competence.
9. NumXL
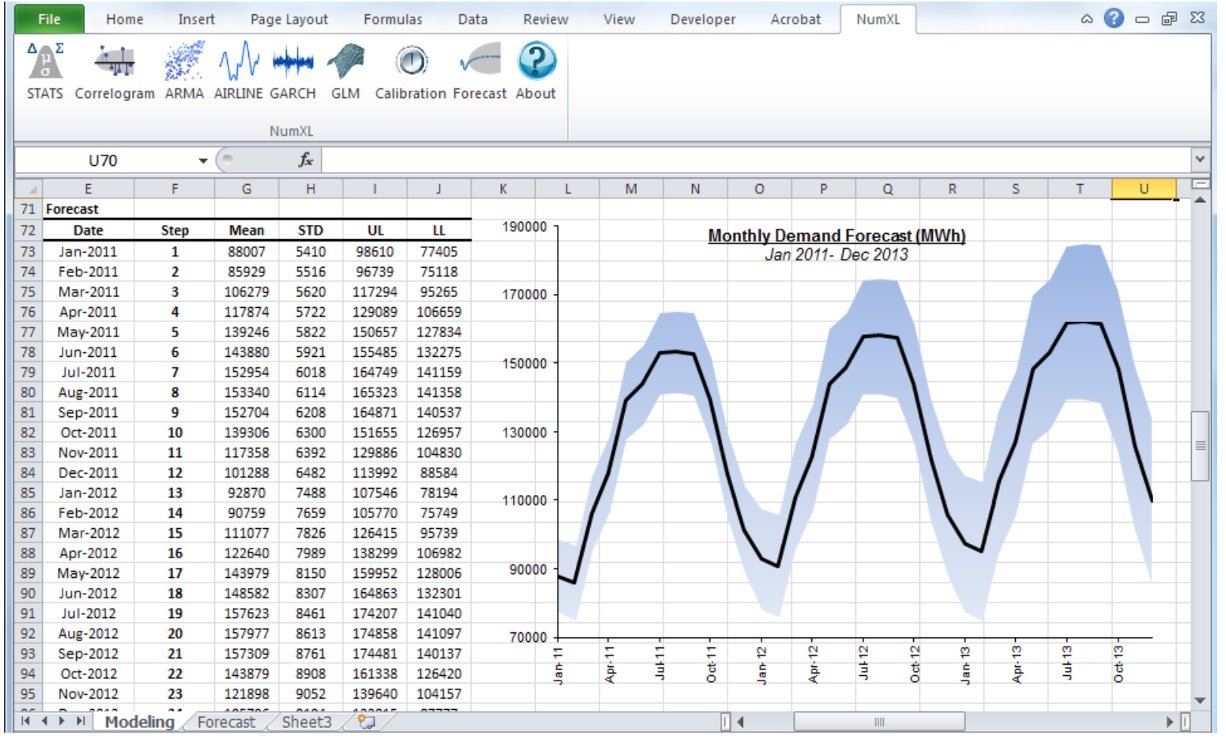
1. NumXL offers a full set of time series analysis tools for evaluating and forecasting time-dependent data, including descriptive statistics, autocorrelation analysis, spectrum analysis, ARIMA modeling, GARCH modeling, and more.
2. Rich visualization choices for visually studying time series data, including line charts, bar charts, scatter plots, and more, with customization options for axes, labels, colors, and styles.
3. For making statistical conclusions regarding time series data, a variety of statistical methods for hypothesis testing, such as t-tests, ANOVA, goodness-of-fit tests, and others, are available.
4. Tools for cleaning data, transforming data, imputation of missing data, and validating data to prepare time series data for analysis.
5. ARIMA forecasting, GARCH forecasting, exponential smoothing, and other advanced forecasting capabilities are available for creating reliable forecasts and predictions based on historical time series data.
6. Model validation tools, including as model evaluation metrics, model diagnostics, and residual analysis, are used to evaluate the accuracy and dependability of time series models.
7. Monte Carlo simulations in time series forecasting for probabilistic analysis, uncertainty analysis, and scenario analysis.
8. Integrates seamlessly with Microsoft Excel, allowing for time series analysis and forecasting in the familiar Excel interface, as well as the ability to use Excel formulas and functions in NumXL.
9. User-friendly interface with intuitive menus, dialog boxes, and wizards that allow even users with modest statistical ability to execute time series analysis and forecasting tasks.
10. Qualtrics DesignXM
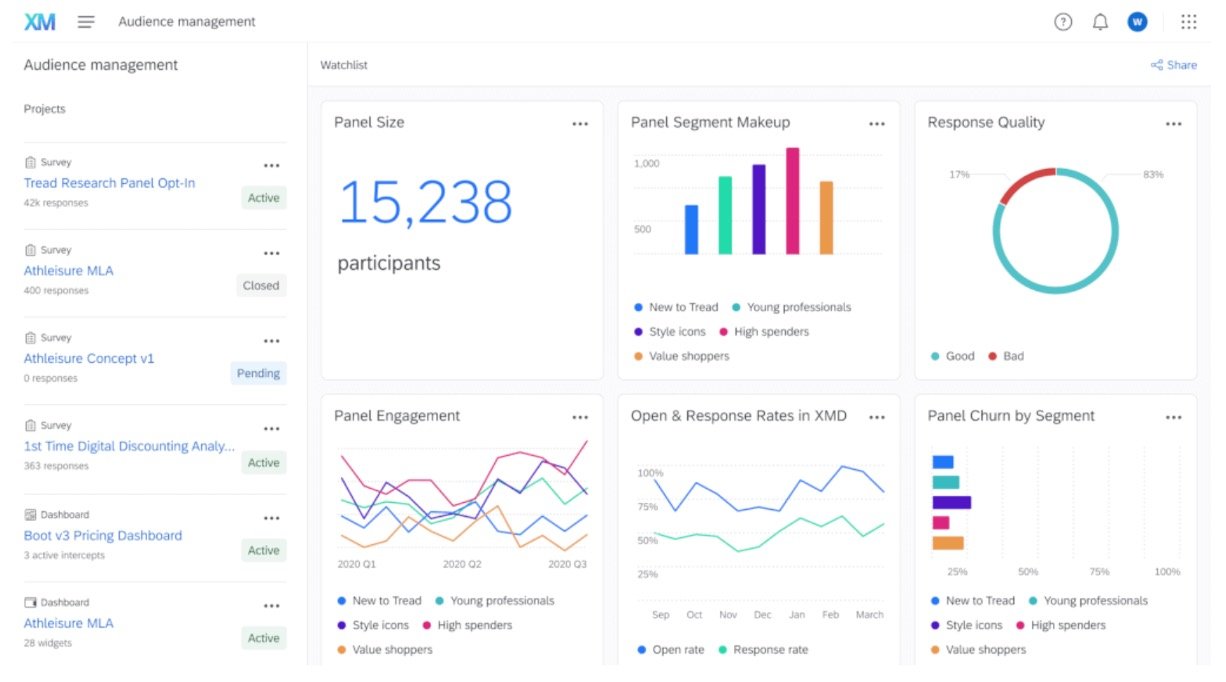
1. Drag-and-drop interface for constructing bespoke surveys with a variety of question formats such as multiple choice, open-ended, matrix, and more.
2. Advanced logic and branching capabilities are used to develop dynamic surveys that adjust based on the responses of respondents, ensuring that relevant questions are asked based on prior responses.
3. Tools for team collaboration, enabling for the smooth sharing and editing of surveys, survey templates, and survey libraries.
4. Responsive design is used to construct surveys that are tailored for mobile devices, ensuring that respondents have a pleasant and interesting experience on any device.
5. Options for randomizing questions and answer choices to reduce order bias and adjust for potential survey bias.
6. Capability to translate surveys into numerous languages in order to reach a wide audience and collect data from various locations or countries.
7. Survey themes, colors, typefaces, and logos may all be customized to match your organization’s brand identity.
8. Options for testing and previewing surveys before distribution to ensure the accuracy and quality of the survey design.
9. Sophisticated question kinds for sophisticated research and data collection, such as conjoint analysis, MaxDiff, and semantic differential.
10. Integration with external panels and sample suppliers for simple survey respondent recruitment and management.
11. Capabilities for powerful reporting and analytics to analyze and visualize survey results, including charts, tables, and statistical analysis.
11. Posit

1. A platform that allows users to analyze data, share projects, and teach classes and workshops. It also provides a Public Package Manager for managing packages and a secure environment for running data science projects.
2. A tool for building data products in R and Python using Jupyter, VSCode, and RStudio. It enables data science teams to deliver interactive reports and applications, leverage large amounts of data, integrate with existing enterprise systems, and be compliant with security practices and standards.
3. This tool allows users to host all the data products they create, enabling them to deliver interactive reports and applications to decision-makers, leverage large amounts of data, integrate with existing enterprise systems, and be compliant with security practices and standards.
4. A free service that provides easy installation of package binaries and access to previous package versions.
5. It offers a detailed guide on how projects run in their own containers, independent of all other projects, with their own allocation of RAM and CPUs, and how projects can be shared.
6. A collection of nearly 100 instructional guides with code snippets that cover everything from coding basics to data modeling.
12. SAS Viya
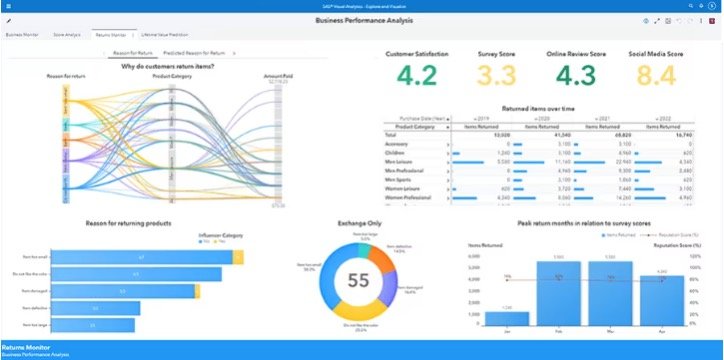
1. SAS Viya is a high-performance AI and analytics platform that offers rapid AI and analytics, faster data integration, effective model development, and reduced cloud costs.
2. It outpaces the competition in executing data and AI tasks with endless scalability, and can lower cloud operating costs by 86% compared to alternatives.
3. SAS Viya integrates seamlessly with other open-source languages, allowing users to focus on problem-solving rather than learning and switching between different tools.
4. It supports the entire analytics life cycle, from data to deployment, and lets users code in SAS, Python, or R.
5. SAS Viya for Learners is a cloud-based software suite that supports the entire analytics life cycle for academic, noncommercial use.
6. It provides a self-service, point-and-click environment for data preparation, interactive visualization tools, a visual, drag-and-drop interface for model creation, and easy model deployment and management.